Did the Trump administration deliver record-low crime and $472 billion in New York?
Did the Trump administration deliver $472 billion in investment and a 48% drop in murders to New York, as JD Vance's 'We got your back, New York!' post claims?
Misleading
Real numbers, real graphic — but nationwide pledges and a state programme are presented as federal New York results.
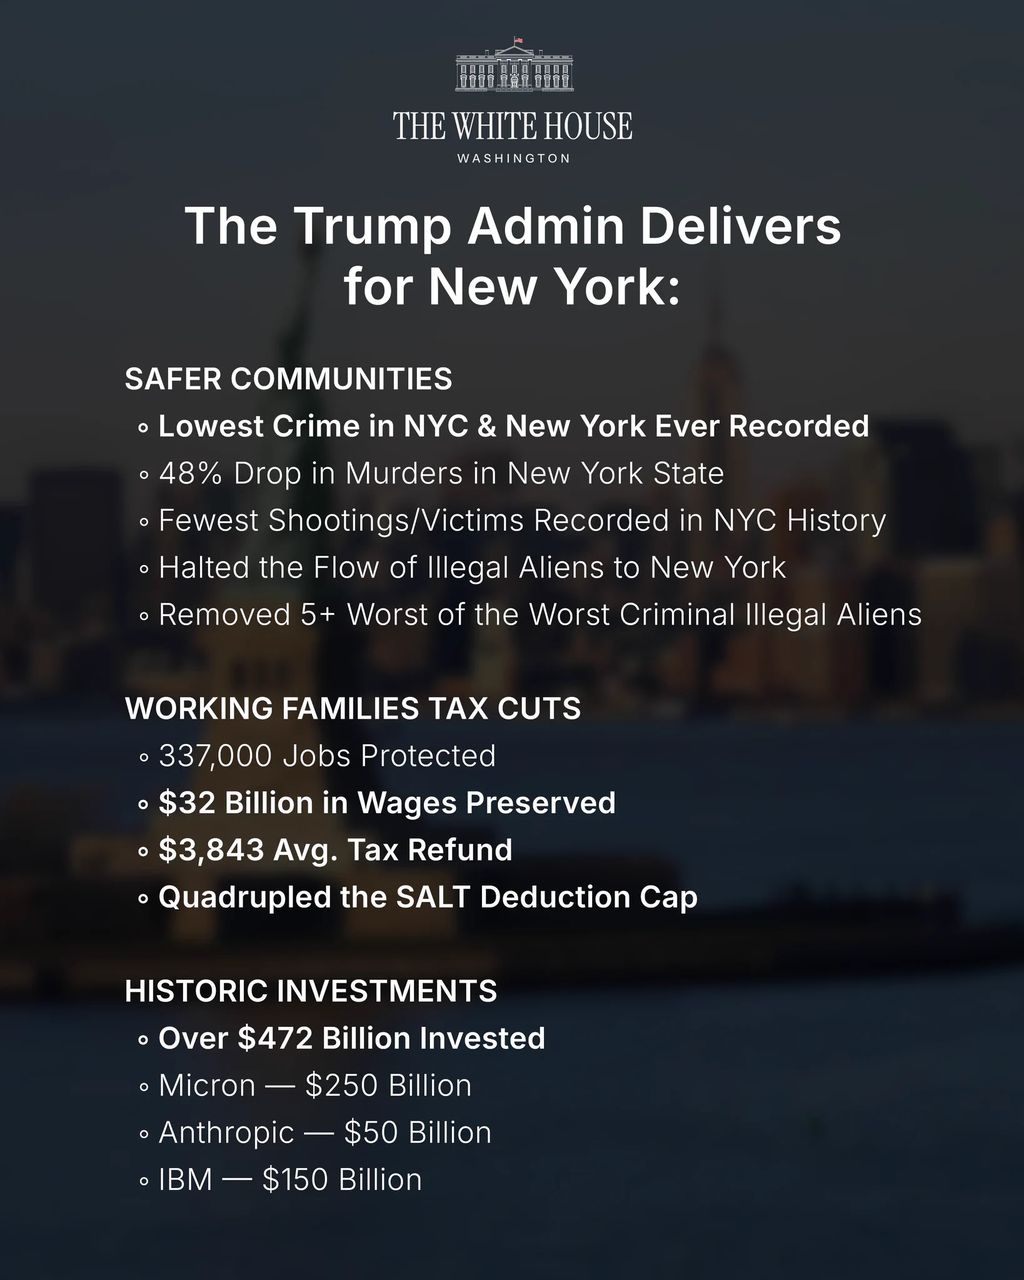
The White House graphic posted by Vice President JD Vance on 2 November 2026 is genuine and most of its numbers exist, but it is misleading. The '$472 billion' adds up nationwide corporate pledges, and the '48% drop in murders in New York State' comes from New York's own GIVE programme, not the federal government.
 Genuine
Claims
✓ 2 trueThe 'over $472 billion invested in New York' total reflects New York-specific investment by Micron ($250B), Anthropic ($50B) and IBM ($150B).45678
“Over $472 billion invested”
The $472bn figure is an arithmetic sum of three corporate pledges, and none of the three is a New York investment figure. Micron said it would spend more than $250bn across the United States through 2035, with up to about $100bn potentially going to its Clay, New York site — a company statement reported by Senator Schumer's office as covering New York, Idaho and Virginia. Anthropic's $50bn is for data centres in Texas and New York together. IBM's $150bn is a five-year plan for the whole United States, announced by a company headquartered in Armonk, New York. Adding nationwide commitments and labelling the total 'invested in New York' inflates the state number several times over. The sources here are mostly the companies' own announcements, which are primary but self-interested; the New York Times and Reuters reporting on IBM independently confirms the national scope of that pledge. What settles it is not any single company's number but the mismatch between what each announcement says it covers and how the graphic adds them up.
New York City recorded the lowest crime ever recorded.12
“Lowest crime in NYC and New York ever recorded”
For New York City the record claim holds for the measures the NYPD tracks and publishes. The department reported 203 murders, 489 shooting incidents and 594 shooting victims in the first nine months of 2026, each a record low for that period, with murders down about 20% from 253 a year earlier. That is a primary official dataset, corroborated by local reporting. The claim weakens when it extends to New York State: the graphic gives no state-level indicator or time period, and the state does not publish a single combined 'crime' index, so a statewide 'lowest ever recorded' cannot be verified as written. The confidence is moderate rather than high because the city half is solid and the state half is unsupported, not because the city data is in doubt.
Still open: No statewide crime index supports the broader 'New York' wording.
Murders in New York State fell 48%.111
“48% drop in murders in New York State”
The 48% figure exists, but it belongs to a different thing than the graphic implies. It comes from New York State's own Gun Involved Violence Elimination (GIVE) programme, which covers 28 participating police departments and measured January to May 2026. That is a state-run programme's result over part of a year, not a statewide murder rate and not a federal achievement. The NYPD's citywide data, by contrast, shows murders down roughly 20% year to date. The gap between 48% and 20% is the tell: a reader is meant to see the larger number and credit the administration. The decisive evidence is the X Community Note and HuffPost's reporting spelling out the GIVE programme's scope, set against the NYPD's own citywide figure. The graphic gives no period and no source, which is what allows a programme statistic to stand in for a statewide one.
New York City recorded the fewest shootings and shooting victims in its history.12
“Fewest shootings and shooting victims recorded in NYC history”
This is the claim the graphic gets cleanly right. NYPD data released in October 2026 records 489 shooting incidents and 594 shooting victims in the first nine months of the year, both record lows for that span, as reported by the department and by local outlet ABC7. The figure is a primary official statistic from the agency that compiles it, independently repeated by a news outlet, and nothing in our searches contradicted it. The record applies to the January-to-September period rather than a full calendar year, which is how the department itself frames it. High confidence here rests on a single authoritative dataset that is published, dated and reproducible — the opposite of the unsourced numbers elsewhere on the same graphic.
The administration quadrupled the SALT deduction cap.910
“Quadrupled the SALT deduction cap”
The One Big Beautiful Bill Act, enacted in July 2025, raised the state and local tax deduction cap from $10,000 to $40,000 for tax year 2025 — a quadrupling, as both a congressional office and the National Association of REALTORS describe it. That makes the headline number accurate. The graphic omits two conditions that matter to anyone estimating their own benefit: the cap phases down by 30% of modified adjusted gross income above $500,000, and it reverts to $10,000 in 2030. A primary congressional statement and an industry explainer independently agree on both the increase and the caveats. High confidence because the legislation is a matter of public record, not an estimate; the only issue is that the graphic stops at the favourable half of the story.
The administration protected 337,000 jobs and preserved $32 billion in wages.
“337,000 jobs protected and $32 billion in wages preserved”
The graphic gives no period, no method and no source for either number, and our searches found no federal or New York dataset that matches them. The phrasing appears to echo the administration's own 'Working Families Tax Cut' messaging rather than an independently published statistic, which would make it a communications figure rather than a measured outcome. Without a defined baseline — protected compared with what, over what period — the claim cannot be tested even in principle. This is the weakest kind of number on the graphic: specific enough to sound researched, vague enough to resist checking. We mark it unverifiable rather than false because we cannot show the figure is wrong, only that nothing published supports it.
Still open: What period, baseline and methodology the figures refer to.
The average tax refund is $3,843.
“$3,843 average tax refund”
No tax year, geography or source accompanies the $3,843 figure, and we found no IRS or New York publication matching it as a New York-specific average refund. The IRS publishes average refunds nationally, not as a New York outcome of a particular administration's policy, so the figure as framed has no obvious published home. A precise dollar amount creates an impression of administrative record-keeping, but precision is not the same as provenance. We could neither confirm nor refute the number, so it stays unverifiable. Readers should treat it as an assertion until the graphic or its publisher supplies the tax year and the dataset behind it.
Still open: Which tax year and which dataset the figure comes from.
The administration halted the flow of illegal aliens to New York.
“Halted the flow of illegal aliens to New York”
There is a real trend underneath this: southern border apprehensions fell sharply in 2025 and stayed low, and New York City's shelter intake from buses of migrants dropped steeply. But 'halted the flow' is an absolute, and the graphic supplies no New York-specific data to support the absolute. A sharp decline and a halt are different claims, and only the first is documented. Because the graphic itself offers nothing checkable here, the verdict rests on the general trend rather than on evidence tied to the post, which is why confidence is low. The honest reading is that migration pressure eased markedly while the word 'halted' overstates what any published figure shows.
Still open: What New York-specific measure, if any, the claim is based on.
The administration removed '5+ worst of the worst criminal illegal aliens'.
“Removed 5+ worst of the worst criminal illegal aliens”
'5+' is a threshold so low it would be met by almost any week of national immigration enforcement, and the graphic gives no names, dates, agency records or New York connection. Thousands of removals occur nationally, so a bare minimum of five tells a reader nothing about scale or about New York. The phrase 'worst of the worst' is a characterisation, not a category that can be checked against records. With no operation, agency or period identified, there is nothing to verify. We mark it unverifiable and note the rhetorical move: a number small enough to be trivially true, stated in language that invites a much larger inference.
Still open: Which agency operation, if any, the line refers to.
What was posted
XAn official White House infographic titled 'The Trump Admin Delivers for New York', shared on X from the Vice President's @VP account on 2 November 2026, the day before the midterm elections. The graphic lists public-safety statistics, tax relief figures, an investment total and immigration claims, asking readers to accept them as the administration's results for New York.
“We got your back, New York!”
Posted from the @VP account and described by outlets including Roya News as an official graphic from the executive office. X appended a Community Note to the post.
Who posted it
XAccount check
Estimates from public signals — account age, posting pattern, audience — not a judgement of the person behind the account, and separate from whether this post is true.
What stood out
- @VP is the official institutional X/Twitter handle of the Office of the Vice President of the United States — a government account, not a private individual.
- Handle was launched by the Office of the Vice President in July 2011 under Biden (covered by White House archives and Fox News), then transferred to Mike Pence (2017), Kamala Harris (Jan 2021), and currently JD Vance (Jan 2025) as part of the standard institutional handover process.
- Because it is a single-word reserved institutional handle, it is effectively immune to the kind of impersonation/squatting risk typical of low-signal handles; recent posts from it are cited in mainstream press (e.g., a 1 Nov 2026 post, "We got your back, New York!").
- The supplied metadata (null display name, bio, followers, creation date, no posts, unverified flag) is almost certainly an incomplete scrape/API artifact rather than evidence of a fake account — the real account is large, active and carries X's government verification label.
- Caveat on reliability: this is a staff-managed political communications channel, not a neutral wire. In Feb 2026 the account posted that Vance had honoured "the victims of the 1915 Armenian genocide" and then deleted it, with aides saying it was "posted in error by staff who were not part of the delegation" — widely covered by The Guardian, Reuters/CNN, Armenian Weekly, and criticised by ANCA and lawmakers.
- So: authentic/official (high authenticity), but its claims should be read as administration messaging and cross-checked; it has a documented instance of retracting a substantive factual statement.
Signals (11)+
- Account created
- 2011-07-04 (Office of the Vice President launch, per Obama White House archive)
- Handle type
- Reserved institutional/government handle
- Current occupant
- Vice President JD Vance (since 20 Jan 2025)
- Prior occupants
- Joe Biden 2011-2017; Mike Pence 2017-2021; Kamala Harris 2021-2025
- Metadata completeness
- Poor — all fields null, likely scrape failure
- Posting cadence
- Staff-managed, event-driven (travel, ceremonies, statements)
- Follower ratio
- Not available
- Notable news coverage
- Extensive — inaugurations, account transitions, Feb 2026 deleted Armenian Genocide post
- Fact check history
- No formal fact-check rating of the account as a source; individual posts have been contradicted/retracted by the office itself
- Deleted post incident
- 2026-02-10 Armenian Genocide post removed ~1 hour after posting
- Bot indicators
- None — human staff operation, no mass-posting/coordination pattern observed
Account checked November 3, 2026, 14:58 UTC
The media
Image✓ What is genuine
The graphic itself is a genuine White House product; the dispute is entirely about the accuracy and attribution of the numbers printed on it, not about whether the image was altered.
The tells
- ●●○ Supporting signal The image is a designed infographic with the White House logo and seal, posted from the Vice President's official account, not a photo of an event.our visual review
- ●●○ Supporting signal Outlets including HuffPost, Roya News and The Mirror describe it as an official graphic from the executive office.HuffPost, Roya News and The Mirror
- ●●○ Supporting signal Nothing in the image implies photography of a real scene, so there is no fabricated visual element to detect.our visual review
Synthetic-media detector
Detector not consultedThe media is incidental to the claim; the detector was not needed.
How we checked the media
- Reviewed the graphic visually: a static infographic carrying the White House logo and seal, with no photographic scene.
- Compared the design against the post's context as an official product of the executive office, as described by Roya News and The Mirror.
- Checked whether any outlet reported tampering or generated imagery in the graphic — none did.
Sources
13 sources reviewed- 1NYPD announces fewest shooting incidents, shooting victims and murders in recorded history for first nine months of 2026 ↗
NYC.gov (NYPD) · nyc.govPrimary / fact-checkerprimary/official source (by domain)Evidence
NYPD's own statistics establish record-low murders and shootings for the first nine months of 2026 and a roughly 20% citywide murder decline.
- 2NYPD says shootings and murders reached record lows through September ↗
ABC7 New York · abc7ny.comUntiereduntiered — treated as signal only, never decisiveEvidence
Local reporting corroborates the NYPD's record-low shooting and murder figures.
- 3Micron Accelerates U.S. Investments, Pours First Concrete at New York Fab ↗
Micron Technology · investors.micron.comUntiereduntiered — treated as signal only, never decisiveContext
Micron's announcement frames its $250bn spend as a national programme through 2035.
- 4Micron New York expansion page ↗
Micron Technology · micron.comUntiereduntiered — treated as signal only, never decisiveEvidence
Micron's own page puts potential investment in its New York site at up to about $100bn.
- 5Schumer celebrates Micron's first concrete pour ↗
U.S. Senator Chuck Schumer · schumer.senate.govPrimary / fact-checkerprimary/official source (by domain)Evidence
A Senate office describes Micron's $250bn as covering New York, Idaho and Virginia.
- 6Anthropic invests $50 billion in American AI infrastructure ↗
Anthropic · anthropic.comUntiereduntiered — treated as signal only, never decisiveEvidence
Anthropic's $50bn covers data centres in Texas and New York together.
- 7IBM Plans to Invest $150 Billion Domestically in Latest Tech Sector Pledge ↗
The New York Times · nytimes.comReputable outletLean Left (AllSides) — distinguish news/opinionEvidence
The New York Times identifies IBM as New York-headquartered and its $150bn pledge as domestic.
- 8IBM to invest $150 billion in US over next five years ↗
Reuters · reuters.comReputable outletwire — Center (AllSides)Evidence
Reuters confirms IBM's $150bn is a US-wide five-year investment.
- 9Lawler Celebrates Big, Beautiful Bill That Quadruples SALT Cap For The Next Ten Years ↗
Congressman Mike Lawler (.gov) · lawler.house.govPrimary / fact-checkerprimary/official source (by domain)Evidence
A congressional statement confirms the SALT cap was quadrupled to $40,000.
- 10SALT Deduction Cap Delivers Relief to Homeowners ↗
National Association of REALTORS · nar.realtorUntiereduntiered — treated as signal only, never decisiveEvidence
Explains the SALT phase-down above $500,000 income and the 2030 reversion to $10,000.
- 11Zohran Mamdani Trolls JD Vance's New York Boast With A 'Brutal' 9-Second Video ↗
HuffPost · huffpost.comLow reliabilityLeft — partisan digitalEvidence
Reports the Community Note's points on the $472bn and the GIVE programme origin of the 48% figure.
- 12Mamdani responds with subway meme to White House claims on city achievements ↗
Roya News · en.royanews.tvUntiereduntiered — treated as signal only, never decisiveContext
Describes the post as an official executive-office graphic shared on 2 November 2026.
- 13Mamdani brutally mocks Vance after claiming credit for New York improvements ↗
The Mirror US · themirror.comUntiereduntiered — treated as signal only, never decisiveContext
Corroborates the Community Note and the pushback the post received.
Further reading
- 1NYC.gov (NYPD) The primary NYPD release behind the record-low crime figures, in the department's own words.
- 11HuffPost The clearest account of the Community Note's attribution points and the political reaction.
- 10National Association of REALTORS Explains the SALT increase and the conditions the graphic leaves out.
- 8Reuters Shows how a wire service described IBM's pledge as national, not New York-specific.
The full story
The most effective false impressions rarely use false numbers. This one uses numbers that mostly exist, arranged so a reader draws the wrong conclusion.
Start with crime. New York City genuinely had its safest first nine months on record in 2026 by the measures the NYPD publishes: 203 murders, 489 shooting incidents, 594 shooting victims. That is real, and the graphic's shooting figures are accurate. The problem is the sentence next to them. A 48% murder drop sounds like the same story, bigger — but it comes from New York State's GIVE programme, which covers 28 police departments and measured January to May 2026, while the city's own murder count fell about 20%. Two different measurements, one credited to the federal government.
Then the money. Micron's $250bn, Anthropic's $50bn and IBM's $150bn are all real pledges, announced and dated. But Micron's is a national commitment through 2035 with up to about $100bn for its New York site; Anthropic's covers Texas and New York; IBM's is a five-year plan for the whole country from a firm headquartered in New York. Added together and labelled 'invested in New York', they produce a number several times the actual state figure.
The tax line is the cleanest: the SALT cap really was quadrupled, from $10,000 to $40,000 — though it phases down above $500,000 income and returns to $10,000 in 2030. Real policy, half-told. The jobs, wages and refund figures have no period or source at all.
That mix is why the post felt plausible. X's Community Note and Mayor Zohran Mamdani's mocking reply turned it into a partisan fight, but the underlying lesson is quieter: a real document with real statistics can still be built to mislead.
Kernel of truth
New York City did record its lowest murders and shootings for the first nine months of a year in 2026, and the SALT cap was genuinely quadrupled — real results that the graphic stretches into federal credit for a state programme and nationwide investment.
Timeline
September 30, 2026
End of the period covered by NYPD's record-low crime statistics for the first nine months of 2026. 1NYC.gov (NYPD)
October 2026
NYPD releases data showing 203 murders, 489 shooting incidents and 594 shooting victims, record lows for the period. 2ABC7 New York
November 2, 2026
Vice President JD Vance shares the White House graphic 'The Trump Admin Delivers for New York' on X, the eve of the midterms. 12Roya News
November 2, 2026
An X Community Note and Mayor Zohran Mamdani's reply challenge the graphic; HuffPost, The Mirror and Express Tribune report the pushback. 11HuffPost
How it was framed
Genuine statistics are selected and framed to imply a conclusion they do not support: nationwide corporate pledges counted as New York investment, and a state programme's murder drop presented as a federal result. The individual figures are largely real, which is what distinguishes this from fabrication.
- “Visual proof”. An official-looking White House infographic with seal and logo presents the figures as settled, documented results.
- Missing context. The '48% drop in murders in New York State' appears with no period and no mention of the state-run GIVE programme.
- Selective evidence. The SALT claim states the quadrupling but omits the phase-down above $500,000 income and the reversion to $10,000 in 2030.
- Unsourced statistic. 337,000 jobs, $32 billion in wages and the $3,843 average refund carry no source or period.
- Emotional language. The caption 'We got your back, New York!' frames a list of statistics as a personal pledge of protection.
Posted from the official @VP account on X on 2 November 2026, the day before the midterm elections. The graphic is described by outlets including Roya News as an official product of the executive office. X appended a Community Note to the post, and New York City Mayor Zohran Mamdani replied with a mocking video.
Bias
Leans pro-Trump administration / self-promotional. The graphic is a self-authored White House scorecard issued the day before the 2026 midterms, bundling state-programme crime data, nationwide corporate pledges and general tax-law changes into a single claim that the administration 'delivers for New York'. Every item is framed to credit the administration; no sourcing, time periods or caveats are given.
Bias describes how the post frames its message — the slant of the language, selection and emphasis — and is judged separately from whether the claim is true. A true claim can still be framed with a strong slant.
How we checked
1 min 4 s- 1
Ran searches on each named investment — Micron's $250bn, Anthropic's $50bn and IBM's $150bn — to establish what area and period each pledge covers.
- 2
Searched for the origin of the '48% drop in murders in New York State' figure and for NYPD's 2026 crime statistics.
- 3
Searched the SALT deduction cap and the One Big Beautiful Bill Act to confirm the size of the increase and its conditions.
- 4
Searched reporting on the post's reception, including the X Community Note, Mayor Mamdani's reply and coverage by HuffPost, Roya News and The Mirror.
- 5
Reviewed the graphic visually to confirm it is a designed infographic rather than a photograph, and found no reports of tampering.
✓ Claim checked✓ Media checked✓ Sources checked
Why 80% confidence
HighHigh confidence in the overall MISLEADING verdict because the decisive points rest on primary documents: the companies' own announcements and the NYPD's published data. Individual claims vary — the investment and SALT findings are high confidence because the scope is stated in the source documents, while the jobs, wages and refund figures are low confidence because nothing published matches them.
Limits. We did not run an image-authentication tool, because the media is not pivotal and the dispute is about the numbers rather than the file. We could not identify the datasets behind the jobs, wages, refund and immigration figures, and we did not reach the White House or the @VP account for comment.
What we don’t know
- What period, baseline and methodology the 337,000 jobs, $32 billion in wages and $3,843 refund figures are drawn from.
- Whether the '5+ worst of the worst' removal line refers to any specific enforcement operation, and whether any of it relates to New York.
- What New York-specific data, if any, sits behind the claim that the flow of migrants was 'halted'.
- Whether the White House regards the GIVE programme statistic as a state result it is entitled to credit.
Spot it yourself
Spot the fakeLooks suspicious, isn’t proof
- It was posted by a political account on the eve of an election. Timing is a reason to look closely, not evidence the numbers are wrong.
- The graphic is polished and official-looking. Good design signals resources, not accuracy.
- It lists many statistics at once. Volume can overwhelm, but each number has to be checked on its own.
The actual evidence
- The $472bn total is a sum of three pledges, each of which is national or multi-state in scope. Micron's own page puts its New York site at up to about $100bn of a $250bn national plan.
- The 48% murder drop matches New York State's GIVE programme across 28 departments for January to May, not the NYPD's roughly 20% citywide decline.
- The SALT quadrupling is real but conditional, with a phase-down above $500,000 income and a 2030 reversion to $10,000.
- Several figures — jobs, wages, refund — have no period or source and match no published dataset.
- 1
Check whether a big total is a sum of smaller, differently scoped numbers.
Take each named company or programme and look up what its own announcement says it covers. If one covers the whole country and another covers two states, adding them as one place's investment inflates it.
- 2
Ask who produced a statistic you are being asked to credit.
A city police department, a state programme and a federal agency publish different datasets. Find which body released the number and what area and period it covers before accepting the attribution.
- 3
Look for the missing half of a policy claim.
For tax or benefit figures, search the legislation or a neutral explainer for caps, phase-outs and expiry dates. A true 'quadrupled' can still leave out conditions that change who benefits.
- 4
Treat precise unsourced numbers as claims, not facts.
If a figure like $3,843 or 337,000 jobs has no year, geography or source, search for the official dataset that would publish it. If none matches, note it as unverified and move on.
Takeaway
A document can be genuine, and most of its numbers real, and still be arranged to mislead you about who did what. Check scope and attribution, not just whether the statistic exists.
Questions people ask
Is the White House New York graphic fake?+
No. It is a genuine official infographic, described by outlets including Roya News as a product of the executive office and posted from Vice President JD Vance's @VP account on 2 November 2026. The problem is not the image but how the real statistics on it are selected and attributed.
Where does the 48% drop in murders come from?+
It comes from New York State's Gun Involved Violence Elimination programme, which covers 28 participating police departments and measured January to May 2026. It is not a statewide murder rate and not a federal result. The NYPD's own citywide data shows murders down about 20% year to date.
Is $472 billion really being invested in New York?+
No. The total adds three nationwide or multi-state pledges. Micron's $250bn is a US-wide commitment through 2035 with up to about $100bn for its New York site, Anthropic's $50bn covers Texas and New York, and IBM's $150bn is a five-year plan for the whole country.
Did the SALT cap really quadruple?+
Yes. The One Big Beautiful Bill Act raised the state and local tax deduction cap from $10,000 to $40,000 for 2025, which is a quadrupling. The graphic omits that the cap phases down above $500,000 income and reverts to $10,000 in 2030.
Why do official-looking graphics with real numbers still mislead?+
Because a real number can be scoped to something other than what the layout implies. Counting national pledges as local investment, or a state programme as a federal result, changes the meaning without changing any digit. Checking who produced a statistic, and for what area and period, is the defence.
Go deeper
- GIVE programme
- New York State's Gun Involved Violence Elimination programme, which funds and tracks a set of participating police departments rather than the whole state.
- SALT deduction cap
- The limit on how much state and local tax a household can deduct from federal taxable income, raised from $10,000 to $40,000 for 2025 by the One Big Beautiful Bill Act.
- Community Note
- A crowd-sourced correction that X can attach to a post when enough contributors rate it as needing context.
- Scope
- The area, population and time period a statistic actually covers — the detail that determines what a number can and cannot prove.
- Misleading content
- Genuine information used or framed in a way that leads people to a false conclusion.
People also search for
For educators+
- The graphic says '$472 billion invested'. If every company's number is accurate, what exactly is wrong with adding them together? Rewrite the line so it would be accurate.
- A 48% murder drop from a state programme and a 20% citywide decline are both true. Why might a reader who saw only the 48% feel misled even though no number was invented?
- What would you need to see to verify the 337,000 jobs figure — and why is a number without a baseline hard to check at all?
About this check
- Platform
- X
- Posted by
- @vp
- Posted
- November 2, 2026
- Age when checked
- Under 24 hours old when checked
- Where it spread
- United States
- Audience
- US audience
- Language
- EN
- Status
- ● Post is live
- Verified
- November 3, 2026, 15:00 UTC
- Published
- November 3, 2026, 15:00 UTC
Reach. 8,668 likes on @VP post; Community Note added (per HuffPost); Mamdani's meme quote-reply has 1,484,496 likes (syndication); covered by HuffPost, Express Tribune
This verdict was generated with AI from the sources shown. AI can make mistakes — check the sources before relying on it.
Check anything yourself, in seconds.
Share any social post or video to What the Fact and get the verdict, the confidence, and the receipts.