Did the US stock market lose $2.8 trillion in a single day — the biggest wipeout in history?
Was the $2.8 trillion lost on Nov 5, 2026 the biggest single-day wipeout in US stock market history, beating a $2.69 trillion Covid-crash record?
True, but…
The $2.9 trillion S&P 500 record holds, but the $2.8 trillion was an intraday number and the “record” depends on the measure.
Mostly true, with one caveat. On Thursday 5 November 2026, US stocks fell sharply and Dow Jones Market Data estimated that S&P 500 companies lost about $2.9 trillion in market value — a single-day record, above the roughly $2.69 trillion lost on 16 March 2020. The post's $2.8 trillion was an intraday figure. Broader whole-market estimates put the day's loss lower.
 Genuine
Claims
✓ 2 true$2.8 trillion was wiped out from the US stock market on 5 November 2026, the largest single-day wipeout in history.13457
“$2.8 Trillion has been wiped out from the US stock market today so far, the largest one in history.”
The strongest evidence comes from Dow Jones Market Data, reported by the Wall Street Journal and cited by MarketWatch: S&P 500 companies lost about $2.9 trillion in market value in the 5 November session, and Nasdaq companies about $2.5 trillion, both described as single-day records. That makes the post's core claim correct, and the $2.8 trillion figure looks like an intraday estimate that was slightly exceeded by the close. The sources are not fully independent: the Wall Street Journal, MarketWatch, the New York Post and Chosun Ilbo all trace their numbers back to the same Dow Jones Market Data estimate, so they count as one origin rather than four separate confirmations. The caveat is measurement scope. The record applies to index constituents: the companies in the S&P 500 and the Nasdaq. A Community Note on the post cites about $2 trillion lost that day and about $3.5 trillion on 16 March 2020, using a broader whole-market measure. That makes “biggest ever” true on the series that produces the $2.69 trillion 2020 comparison, but not necessarily on every measure. Readers should weigh the record as real on the S&P 500 measure, while treating the exact dollar figure as an estimate.
Still open: The exact figure depends on which market series is used; broader whole-market estimates were lower, around $2–2.5 trillion, and we could not verify the Community Note's $3.5 trillion figure for March 2020 from the sources in this check.
Previously, the largest single-day wipeout was $2.69 trillion during the Covid crash.18
“Previously, the largest single-day wipeout was of $2.69 Trillion during the Covid crash.”
This comparison holds on the same measure as the main claim. Reporting from 16 March 2020, attributed to Reuters and carried by Tasnim, put the S&P 500's market-value decline that day at about $2.69 trillion, consistent with a roughly 12% fall in an index then worth about $22–24 trillion. That figure is lower than the roughly $2.9 trillion estimated for 5 November 2026, so the post's ranking of the two days is correct on the S&P 500 series. The caveat is that the $2.69 trillion applies to S&P 500 constituents, not to every listed US company, so it cannot be directly compared with whole-market estimates such as the $3.5 trillion cited in the Community Note. The Reuters attribution comes through a single relay source rather than a directly opened Reuters article in this check, which is why confidence here is moderate rather than high. Readers should treat the number as the standard comparator on the same index-constituent basis.
Still open: We did not open the original 2020 Reuters article directly; the $2.69 trillion figure reaches us through a relay source.
What was posted
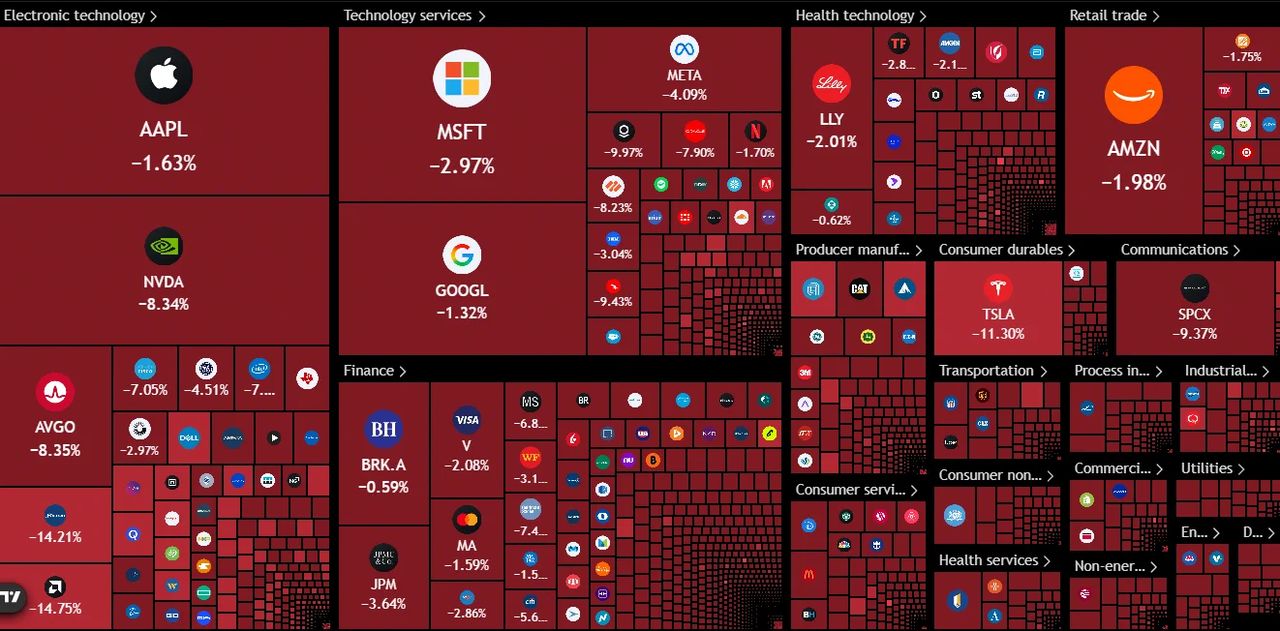
XA post on X from the account The Macro Paper (@macropaperr) claims the US stock market suffered its biggest single-day wipeout in history, putting the loss at $2.8 trillion and comparing it with a previous record of $2.69 trillion during the Covid crash. The post includes an image of a market heatmap showing a broad selloff, with most tiles in red and large declines for technology and chip stocks. The post asks readers to accept that the day's loss was both enormous and unprecedented.
“🚨 BIGGEST SINGLE-DAY WIPEOUT IN US STOCK MARKET HISTORY $2.8 Trillion has been wiped out from the US stock market today so far, the largest one in history. Previously, the largest single-day wipeout was of $2.69 Trillion during the Covid crash.”
Posted on X during the US trading session on 5 November 2026. No engagement metrics or posting group were recorded. A Community Note disputing the record was later appended to the post.
Who posted it
XAccount check
Estimates from public signals — account age, posting pattern, audience — not a judgement of the person behind the account, and separate from whether this post is true.
What stood out
- Profile is a branded macro/markets media account ('The Macro Paper', bio: 'Global Capital Markets Simplified: News, Research, Every Macro Headwind'), not an individual — operator unnamed and unverified on the platform.
- Active, real and widely read: posts in Sept–Nov 2026 routinely rack up 5k–370k+ views and are quoted by CFA/CIO-level LinkedIn commentators, CoinMarketCap, Digg's aggregator and finance forums — evidence of genuine reach rather than an empty shell.
- Content is largely repackaged wire/news material (Reuters, CNBC, Bloomberg, The Independent) and official data (PPI, homebuilder confidence, Treasury yields, CFTC positioning) — core numbers in sampled posts check out against primary coverage.
- However, framing is consistently sensationalist and engagement-bait: all-caps '🚨 MELTDOWN / BUBBLE HAS POPPED / FREE FALL' headlines, mathematically loose '$X trillion wiped out in N hours' claims, and the '$6.33 lost per $1 of Mag 7 capex' style derived stats.
- At least one recent post is premature/misleading on a fast-moving story: it declared 'PARAGUAY'S PRESIDENT HAS RESIGNED' on Nov 5, while AP/BBC/Reuters report the resignation was announced but not accepted by Congress, with impeachment still pending.
- Very high posting cadence (multiple posts per hour across Asian/European/US sessions, 1,110 posts total) with a highly templated voice — consistent with a small team or semi-automated publishing pipeline, not a personal account.
- No fact-checker rulings, suspensions, or coordinated-inauthentic-network designations found; also no transparency about ownership, funding, or editorial standards.
- Bio claims 'research', but output is mostly news aggregation plus chart-based macro narratives (e.g. gold vs 10Y yield thesis) presented without methodology.
Signals (12)+
- Posting cadence
- Very high — multiple posts per hour during market hours; ~1,110 total posts
- Follower ratio
- Unknown (follower count not supplied); individual post views 5k–370k indicate substantial audience
- Display name
- The Macro Paper
- Bio
- Global Capital Markets Simplified: News, Research, Every Macro Headwind.
- Operator transparency
- None found — no named author, no about page, no ownership disclosure
- Content type
- Macro/markets news aggregation with sensationalist headlines and chart-based commentary
- Sourcing quality
- Mixed — frequently cites/paraphrases Reuters, CNBC, Bloomberg, IMF and official data, but often without links and with alarmist spin
- Verified example true
- Paraguay Ueno Bank collapse and Peña resignation announcement (Nov 5, 2026) corroborated by AP, BBC, Reuters
- Verified example overstated
- 'President HAS RESIGNED' — resignation announced but not accepted by Congress as of Nov 6, 2026
- Third party citations
- LinkedIn posts by Charles-Henry Monchau (CFA/CIO), Tyler Jensen; CoinMarketCap guest article; Digg aggregation; finance forums and Japanese/Portuguese blogs
- Fact check history
- None found
- Notable news coverage
- Referenced in Digg, CoinMarketCap, Foresight News wiki; no mainstream outlet profiles of the account itself
Account checked November 6, 2026, 02:46 UTC
The media
Image✓ What is genuine
The heatmap appears to be a genuine intraday market-map screenshot of the 5 November 2026 session. The stock-level figures on it line up with dated reporting of that day's trading.
The tells
- ●●● Strong signal The heatmap's individual stock moves match dated reporting of that day's intraday prices: Nvidia -8.34%, AMD -14.21%, Broadcom -8.35% and Tesla -11.30%, with Nvidia reported down about 8.3% in morning trading.our visual review, compared with the Associated Press report
- ●●○ Supporting signal The image is a data visualisation (a market heatmap) rather than a staged scene, so compositing or generation artifacts would not be the right thing to look for.our visual review
- ●○○ Weak signal The overall picture is uniformly red across sectors, which is what a broad selloff of this kind produces.our visual review
Synthetic-media detector
Detector not consultedThe media is incidental to the claim; the detector was not needed.
How we checked the media
- We reviewed the image visually and compared the stock-by-stock moves shown on the heatmap with dated reporting of intraday prices from the same session.
Sources
8 sources reviewed- 1Nasdaq, S&P 500 Suffer Biggest Market Cap Losses on Record ↗
The Wall Street Journal · wsj.comReputable outletnews centrist; opinion Lean RightEvidence
Dow Jones Market Data estimates of about $2.9 trillion for S&P 500 companies and $2.5 trillion for Nasdaq companies, both single-day records.
- 2Wall Street Gets $2.5 Trillion AI Reality Check With Historic Rout of Tech Stocks ↗
The Wall Street Journal · wsj.comReputable outletnews centrist; opinion Lean RightContext
Describes the day as the worst since April 2025 and places the Nasdaq in correction territory.
- 3Wall Street sees biggest market cap drops ever after midterm bloodbath for GOP ↗
New York Post · nypost.comLow reliabilityLean Right; tabloid — corroborateEvidence
Repeats the $2.9 trillion and $2.5 trillion record figures and adds that the Magnificent 7 lost $1.04 trillion.
- 4Wall Street bloodbath: $2.5 trillion wiped out as Nasdaq suffers worst crash in 18 months ↗
The Times of India · timesofindia.indiatimes.comUntiereduntiered — treated as signal only, never decisiveEvidence
Reports about $2.5 trillion wiped out and the Nasdaq's 5.5% fall, a lower estimate on a different measure.
- 5US stocks suffer worst rout since 2020: Dow plunges 1,800 points, Nasdaq crashes 5.5% as AI fears wipe out $3 trillion ↗
The Economic Times · economictimes.indiatimes.comUntiereduntiered — treated as signal only, never decisiveEvidence
Reports around $3 trillion lost from S&P 500 market value and gives the day's index moves.
- 6Sinking: AI selloff erases Wall Street's post-election rally, S&P 500 drops more than 3% ↗
Alaska Story (Associated Press report) · thealaskastory.comUntiereduntiered — treated as signal only, never decisiveEvidence
Gives intraday prices such as Nvidia down 8.3% and AMD down 15.9%, which match the heatmap.
- 7Nasdaq Market Cap Plummets $2.5 Trillion ↗
Chosun Ilbo (English) · chosun-chosun-prod.cdn.arcpublishing.comUntiereduntiered — treated as signal only, never decisiveEvidence
Relays MarketWatch's description of the roughly $2.9 trillion S&P 500 decline as the largest single-day loss on record.
- 8بدترین افت شاخص بورس آمریکا از زمان دوشنبه سیاه رقم خورد (Tasnim, citing Reuters, 16 March 2020) ↗
Tasnim News Agency (Iranian state media, relaying Reuters) · tasnimnews.irUntiereduntiered — treated as signal only, never decisiveEvidence
Relays Reuters' figure of about $2.69 trillion lost by the S&P 500 on 16 March 2020.
Further reading
- 1The Wall Street Journal The Wall Street Journal report gives the primary estimate and the record comparison in detail.
- 7Chosun Ilbo (English) Explains how MarketWatch, citing Dow Jones Market Data, described the S&P 500 loss as a record.
- 8Tasnim News Agency (Iranian state media, relaying Reuters) Provides the 16 March 2020 comparator figure that the post relies on.
The full story
The claim rests on a real and unusually large market event. On Thursday 5 November 2026, US stocks sold off hard after Democratic gains in the midterm elections raised fears of tighter regulation of data centres and AI infrastructure. The Nasdaq Composite fell about 5.5% into correction territory, the S&P 500 lost about 4.4% and the Dow dropped roughly 1,833 points.
Dow Jones Market Data estimated that S&P 500 companies shed about $2.9 trillion in market value that day, with Nasdaq companies losing about $2.5 trillion. Both were described as single-day records, above the roughly $2.69 trillion erased on 16 March 2020 during the Covid crash. The New York Post noted that the Magnificent 7 stocks alone lost $1.04 trillion on the Thursday.
The post was published during the trading session, which explains its $2.8 trillion “so far” figure: the closing estimate came in slightly higher. That is also where the confusion starts. Different outlets used different measures. The Times of India reported about $2.5 trillion. The Economic Times reported about $3 trillion for the S&P 500. A Community Note on the post argued that only about $2 trillion was lost that day, compared with about $3.5 trillion on 16 March 2020, using a broader whole-market measure.
So the post's headline is broadly right on the measure it implicitly uses, the S&P 500, but the words “biggest in history” depend on which series you pick. That is why this is a TRUE_BUT rather than a clean TRUE.
Kernel of truth
US stocks did suffer a record single-day market-cap loss on 5 November 2026 on the S&P 500 measure, and the previous record was indeed set during the March 2020 Covid crash.
Timeline
March 16, 2020
The S&P 500 falls about 12% during the Covid crash; its market value drops by about $2.69 trillion, the previous single-day record on that measure. 8Tasnim News Agency (Iranian state media, relaying Reuters)
November 5, 2026
US stocks sell off sharply after the midterms amid AI-valuation and data-centre-regulation fears. The Nasdaq falls about 5.5%, the S&P 500 about 4.4% and the Dow about 1,833 points. 1The Wall Street Journal
November 5, 2026
Dow Jones Market Data estimates that S&P 500 companies lost about $2.9 trillion and Nasdaq companies about $2.5 trillion in market value, both single-day records. 1The Wall Street Journal
How it was framed
The post's central figure and its “biggest ever” framing are broadly supported by Dow Jones Market Data as reported by the Wall Street Journal and MarketWatch, so this is not fabrication. But the post presents an intraday estimate as a final number and does not say which market measure the record applies to, which lets readers assume a whole-market record that other estimates do not support.
- Emotional language. The all-caps opening line “🚨 BIGGEST SINGLE-DAY WIPEOUT IN US STOCK MARKET HISTORY” and the alarm emoji frame the news as a catastrophe.
- Missing context. The post cites $2.8 trillion “so far” but does not say which index or market measure the figure covers, or that whole-market estimates were lower.
- “Visual proof”. The attached heatmap, almost entirely red, is presented as visual confirmation of the scale of the selloff.
Posted on X by the account The Macro Paper (@macropaperr), a markets-focused account, during the US trading session on 5 November 2026. A Community Note disputing the record was later appended to the post.
Bias
The alarm-emoji, all-caps 'biggest wipeout in history' framing is sensational, but the underlying figures track published market data rather than pushing a partisan line.
Bias describes how the post frames its message — the slant of the language, selection and emphasis — and is judged separately from whether the claim is true. A true claim can still be framed with a strong slant.
How we checked
1 min 42 s- 1
We ran searches for the post's $2.8 trillion figure and for the record single-day market-cap loss, including searches for the 16 March 2020 comparator and for any fact-check rulings.
- 2
We reviewed the reporting that surfaced, including the Wall Street Journal, the New York Post, MarketWatch as relayed by Chosun Ilbo, the Times of India, the Economic Times and an Associated Press report carried by Alaska Story.
- 3
We compared the heatmap's individual stock moves with the Associated Press report's intraday prices from the same session.
- 4
We checked for existing fact-checks of this specific post and found none.
✓ Claim checked✓ Media checked✓ Sources checked
Why 74% confidence
ModerateConfidence is MODERATE rather than HIGH because the record figure is solid, but it rests mainly on one data provider, Dow Jones Market Data, with several outlets repeating the same estimate. Whole-market estimates differ, and a Community Note disputes the record on a different measure. The 2020 comparator reaches us through a relay source rather than the original Reuters article. Those gaps keep the band below HIGH.
Limits. We did not open any source pages directly; this check relies on search results and snippets. We did not run an automated media detector, so our assessment of the heatmap rests on visual review and comparison with reporting. We did not find a published fact-check of this specific post.
What we don’t know
- Whether the original Reuters article of 16 March 2020 gives exactly $2.69 trillion, or a slightly different figure.
- What precise measure produced the Community Note's roughly $2 trillion and $3.5 trillion figures.
- Whether the post's author intended the figure as an S&P 500 measure or as a whole-market measure.
- How the post was received and shared beyond the recorded Community Note.
Spot it yourself
Find the overstatementLooks suspicious, isn’t proof
- The all-caps headline and alarm emoji make the post feel like clickbait, but an alarming tone does not by itself make a number wrong.
- The account is an anonymous markets page rather than a news organisation, which is a reason to check the figures, not evidence against them.
- The heatmap image looks dramatic and is entirely red, but a genuine selloff day produces exactly that kind of picture.
- A Community Note disputing the record is not automatically correct; in this case it uses a different measure from the post.
The actual evidence
- Dow Jones Market Data, reported by the Wall Street Journal and MarketWatch, estimated about $2.9 trillion lost by S&P 500 companies and about $2.5 trillion by Nasdaq companies, both single-day records.
- The $2.69 trillion figure for 16 March 2020 matches reporting attributed to Reuters, and it is lower than the 2026 estimate on the same S&P 500 measure.
- The stock-level moves on the heatmap match dated reporting of intraday prices that day, such as Nvidia down about 8.3% in morning trading.
- Different outlets reported different totals, from about $2.3–2.5 trillion to about $3 trillion, which shows the figure depends on the measure rather than being invented.
- 1
Find the primary data source behind the number.
Look for who produced the estimate. Here it is Dow Jones Market Data, quoted by the Wall Street Journal. A figure with a named data provider behind it is stronger than one with no source.
- 2
Ask which measure “the market” refers to.
Check whether the figure covers the S&P 500, the Nasdaq, or every listed US company. Records can differ depending on the series, so compare like with like.
- 3
Check whether the number was final or intraday.
Words like “so far” signal a live estimate. Look for closing figures later in the day to see whether the number changed.
- 4
Compare the comparator on the same basis.
When a post says “previously the record was X,” check that X is measured the same way as the new figure. A whole-market figure and an index-constituent figure are not directly comparable.
- 5
Cross-check the visual against independent reporting.
Pick two or three numbers from the image, such as individual stock moves, and see whether dated reporting from the same day gives similar figures.
Takeaway
A record claim is only as strong as its measure. Before accepting “biggest ever,” find out what is being counted, whether the number is final, and whether the old record was counted the same way.
Questions people ask
Did the US stock market really lose $2.8 trillion in one day?+
It lost roughly that much on the S&P 500 measure. Dow Jones Market Data estimated that S&P 500 companies lost about $2.9 trillion in market value on 5 November 2026, slightly more than the post's intraday $2.8 trillion figure. Broader whole-market estimates put the day's loss lower, around $2–2.5 trillion.
Was this really the biggest single-day wipeout in history?+
On the S&P 500 measure, yes. The Wall Street Journal and MarketWatch, citing Dow Jones Market Data, called the roughly $2.9 trillion loss a single-day record, above the roughly $2.69 trillion lost on 16 March 2020. But a Community Note argues the record does not hold on a whole-market measure, so it depends which series you use.
What caused the 5 November 2026 selloff?+
Reporting links it to fears about AI valuations and possible tighter regulation of data centres and AI infrastructure after Democratic gains in the midterm elections. The Nasdaq Composite fell about 5.5% into correction territory, the S&P 500 about 4.4%, and the Dow about 1,833 points.
Is the heatmap image real?+
It appears to be a genuine intraday market-map screenshot. The stock-level moves on it, such as Nvidia down 8.34% and AMD down 14.21%, match dated reporting of intraday prices from the same session. The claim does not depend on the image, because the loss figures can be checked against reported data.
Why do different outlets report different totals?+
Because they measure different things. Some count only S&P 500 companies, others count Nasdaq companies, and others use broader whole-market measures. That is why reported figures range from about $2.3–2.5 trillion to about $3 trillion, even though all describe a very large one-day loss.
Go deeper
- Market capitalisation (market cap)
- The total value of a company's shares, calculated by multiplying the share price by the number of shares.
- Index constituent
- A company whose shares are included in a stock market index such as the S&P 500 or the Nasdaq Composite.
- Intraday
- During the trading day, before the market closes and final figures are set.
- Correction territory
- A market decline of at least 10% from a recent high, often used to describe an index falling into a sustained slump.
- Community Note
- A crowd-sourced annotation added to a post on X to provide context or dispute a claim; it is written by users, not by X.
People also search for
For educators+
- If one data provider estimates a record and several news outlets repeat it, how confident should we be? What would make the evidence stronger?
- The post's $2.8 trillion figure was an intraday number that rose to about $2.9 trillion by the close. Does that make the post wrong, or just early? Where should the line be drawn?
- A Community Note on the post disputes the record using a different measure. How should readers decide which measure is the right one for a “biggest ever” claim?
About this check
- Platform
- X
- Posted by
- @macropaperr
- Posted
- November 5, 2026
- Age when checked
- Under 24 hours old when checked
- Where it spread
- United States
- Audience
- US audience
- Language
- EN
- Status
- ● Post is live
- Verified
- November 6, 2026, 02:48 UTC
- Published
- November 6, 2026, 02:48 UTC
Reach. 25,065 likes, 1,219 replies (X syndication, 2026-11-06 ~03:00Z); embedded by The Blaze 5 Nov; post-midterm AI-stock selloff widely covered (NBC, Axios, Forbes, Benzinga)
This verdict was generated with AI from the sources shown. AI can make mistakes — check the sources before relying on it.
Check anything yourself, in seconds.
Share any social post or video to What the Fact and get the verdict, the confidence, and the receipts.