Are Michigan's voter rolls really at 107.9% of adult citizens?
Does Michigan have more registered voters (107.9%) than adult citizens, with 74 of 83 counties over 100%?
Misleading
Real registration totals, real legal inactive records — but no evidence of an election problem.
The arithmetic is broadly real but the alarm is not. Michigan's voter file holds more total registrations than its citizen voting-age population, but that total includes hundreds of thousands of inactive records the state is legally required to keep. Active registrations sit below 100 percent, as the post's own final line concedes. Courts and fact-checkers have rejected the fraud inference.
 Genuine
Claims
✓ 1 trueThese registration figures amount to 'ELECTION ISSUES' — a problem with Michigan's elections and a risk of fraudulent voting.12345
This is the claim the whole post rests on, and it is where the evidence turns. The numbers above it are largely real; the conclusion drawn from them is not. A federal judge dismissed the Republican National Committee's 2024 suit over Michigan's rolls, noting that the plaintiffs 'do not identify a single voter in any Michigan county who is ineligible to be registered but nonetheless appears as an active voter.' That is the decisive point: a comparison of totals produced no named ineligible registrant and no vote. AFP Fact Check, PolitiFact and Votebeat each reached the same conclusion — that counting every record in the file against a survey-based population estimate measures retention rules, not fraud. A 2026 state auditor general review found 99.99 percent of the 8.3 million records had complete, valid data. The sources here are genuinely independent of one another: a court, a state audit, and three newsrooms working separately. None traces back to a single origin. A reader should weigh the simplest fact of all: the post itself admits active rolls are under 100 percent, which undercuts its own headline.
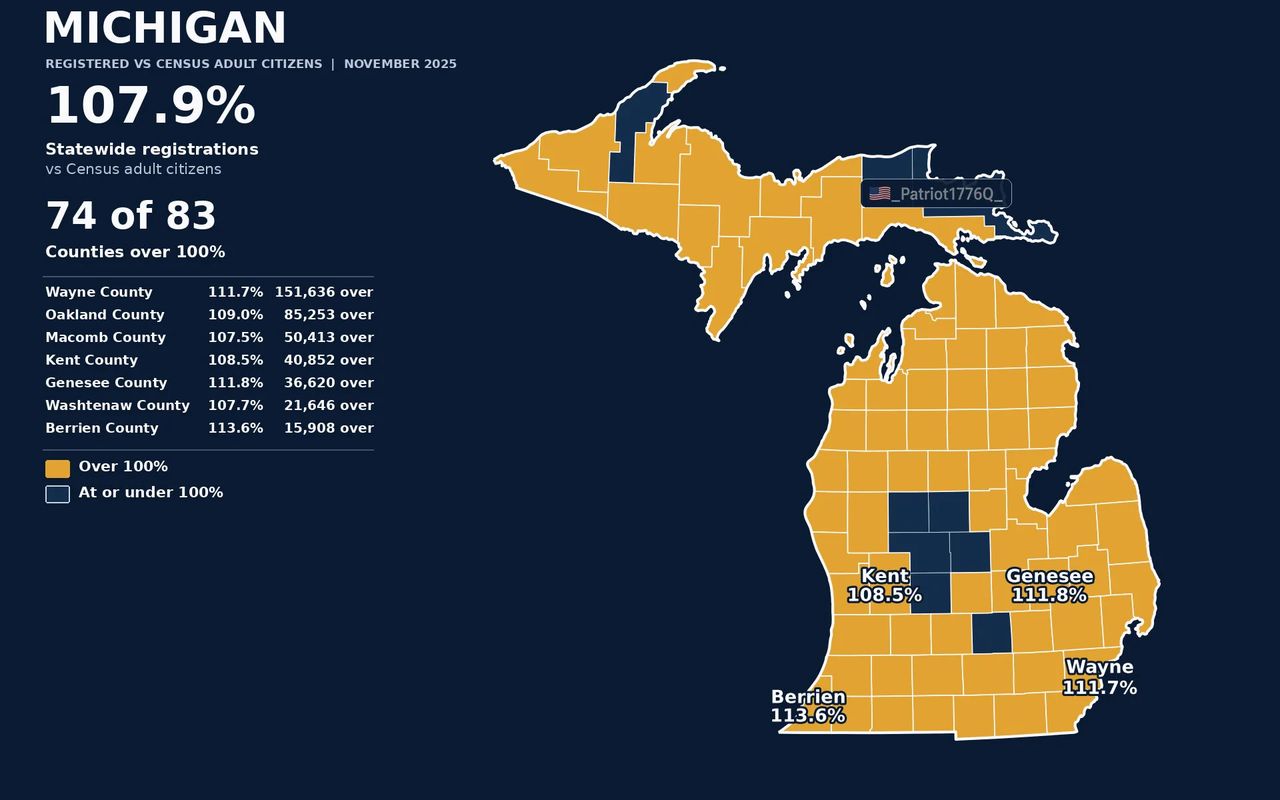
Michigan's statewide official voter rolls are at 107.9% of the Census count of adult citizens (November 2025).126
The ratio is in the right range. Bridge Michigan reported state data showing 8.3 million registered voters against a Census estimate of 7.9 million citizens of voting age, and PolitiFact put the total near 8.4 million — both consistent with a figure around 105 to 110 percent. So the arithmetic is not invented. What makes it misleading is the denominator problem and the numerator problem together. The numerator includes roughly 920,000 inactive records in this graphic, and other reporting puts the inactive share between about 600,000 and 1.2 million. Federal law, chiefly the National Voter Registration Act, bars officials from cancelling those records until the voter has missed two federal election cycles. The denominator is a survey-based estimate with its own uncertainty. Presenting the raw ratio as a percentage of 'adult citizens' hides both. The sources here are independent and consistent: state data via Bridge Michigan, PolitiFact's State Department figures, and Votebeat's reporting.
Still open: The graphic's precise 107.9 percent figure depends on which Census estimate it used and which snapshot of the voter file; neither is stated.
74 of Michigan's 83 counties have more registrations than Census adult citizens, and 72 remain over 100% even after the Census margin of error.6
The direction is documented; the specific count is not. Bridge Michigan reported in 2024 that all but a handful of Michigan counties showed totals above their voting-age populations, so a large majority of counties above 100 percent is consistent with published reporting. That supports the broad shape of the claim. What we could not confirm is the exact number 74, or the margin-of-error arithmetic that leaves 72 over the line. Those come from an analysis the graphic does not name or link. There is also a category problem: several of the sources describe counties exceeding their total voting-age population, not specifically their citizen voting-age population, and those are different measures. A county-level count put together by an unknown analyst is one source, not 83. And as with the statewide figure, county totals include inactive records that cannot legally be removed yet. We rate it partly true and set confidence low because the underlying pattern is documented but the number itself is unverified.
Still open: Who compiled the county-by-county comparison, what Census table was used, and how was the margin of error applied?
Wayne County is 111.7% (151,636 over), Oakland 109.0% (85,253 over), Macomb 107.5% (50,413 over), Kent 108.5% (40,852 over), Genesee 111.8% (36,620 over), Washtenaw 107.7% (21,646 over), Berrien 113.6% (15,908 over).8
We could not match these county-level percentages and overage numbers to any official Michigan publication or news report. The state publishes registered voter counts by county, but not a published ratio against citizen voting-age estimates with these exact values. The numbers appear to come from a private comparison of the voter file with Census estimates that circulated in November 2025, and they turn up only in this account and its reposts. The direction is plausible: large counties with totals above citizen voting-age estimates match what Bridge Michigan and others have documented. But plausible is not the same as confirmed, and precise figures carry an air of authority that invites people to stop checking. One further wrinkle: the graphic's own headline concedes that its totals include inactive records, so even if each county figure were exactly right, the overage would not be an overage of active voters. Until someone publishes the method and the underlying tables, treat these as unverified.
Still open: What source table produced these seven county figures, and would they survive a check against the official county totals?
The official totals include 921,708 registrations not counted as active; active rolls are at 95.9%.236
This is the most useful line in the post, and it is the one that undermines the rest. The picture it describes matches the documented record: Michigan's file carries well over a million inactive registrations in some counts, and roughly 7.2 million active registered voters against a voting-age population near 7.9 million. PolitiFact's figures from the State Department line up with that split. Votebeat's reporting likewise confirms that active registrations do not exceed the eligible population. We call it likely true rather than confirmed because we could not independently check the precise figure of 921,708 against a state publication; the round-number reporting from PolitiFact and Bridge Michigan shows the same structure without that exact count. The importance is logical. If active registrations are below 100 percent, a 107.9 percent total cannot mean more active voters than eligible citizens. The post supplies the correction to its own headline.
Still open: The exact inactive figure of 921,708 could not be tied to a dated state publication.
What was posted
XAn X post with a hand-made data graphic titled "REGISTERED VS CENSUS ADULT CITIZENS | NOVEMBER 2025", showing a Michigan county map with registration-to-population percentages. The caption lists a statewide ratio of 107.9 percent, says 74 of 83 counties are over 100 percent, and names specific overages for Wayne, Oakland, Macomb, Kent and other counties, under an "ELECTION ISSUES" heading. The reader is asked to conclude that Michigan's elections have a registration problem.
“🚨 ELECTION ISSUES: Michigan - Statewide official rolls are at 107.9%. 74 of 83 counties are over 100%. Wayne County is at 111.7%, 151,636 over. Oakland County is at 109.0%, 85,253 over. Macomb County is at 107.5%, 50,413 over. Kent County is at 108.5%, 40,852 over. Genesee County is at 11…”
Posted by the X account @_Patriot1776Q_ on 9 November 2026, a year after the November 2025 data date printed on the graphic. The same text appeared in a Chinese-language repost on Toutiao on 11 November 2026.
Who posted it
XAccount check
Estimates from public signals — account age, posting pattern, audience — not a judgement of the person behind the account, and separate from whether this post is true.
What stood out
- No bio, display metadata, follower count or creation date supplied — zero transparency about who operates the account.
- Handle 'Patriot1776Q' carries QAnon/patriot-conspiracy branding ('1776' + 'Q'); a related 'Patriot1776q (@patriot1776usus)' handle appears in 2024 posts, suggesting rebrands/rotating handles.
- Operates as a high-volume viral-news aggregator: same account posts South Korea bus crash, Jacksonville BMW salon crash, Pennsylvania truck crash, bodycam footage, etc., within days — with non-English outlets (Czech, Macedonian, Spanish, Urdu) repeatedly embedding its posts.
- Some posts credit primary sources (The Virginian-Pilot/Daily Press, police statements), which is a positive sourcing habit.
- However, in Nov 2026 it pushed a repeated multi-state election-fraud narrative ('more registered voters than Census adult citizens' for Colorado, Virginia, New Jersey, Maryland, Texas) that Lead Stories debunked on 10 Nov 2026 — misleading use of ACS 5-year estimates as a headcount.
- Not platform-verified; no evidence of any institutional affiliation or editorial accountability.
- Pattern of rapid, cross-topic, engagement-optimised posting with alarm-emoji headlines is consistent with a semi-automated or team-run partisan aggregation operation rather than a transparent individual commentator.
- Reach is substantial (mainstream and foreign outlets quote its posts), so its misinformation carries real amplification risk.
Signals (8)+
- Posting cadence
- Very high — multiple breaking-news/viral clips per day across unrelated topics
- Profile completeness
- None (no bio, display name, or follower count provided)
- Handle signals
- QAnon-adjacent '1776Q' branding; possible prior handle @patriot1776usus (2024)
- Known affiliations
- None disclosed; no institutional or press affiliation
- Fact check history
- Debunked by Lead Stories (10 Nov 2026) for 'voter registration exceeds adult citizens' claims across CO, VA, NJ, MD, TX
- Notable news coverage
- Frequently quoted/embedded by mainstream and international outlets as a viral-video source (CNN Prima, Economic Times, RedState, LifeSite, TV Azteca)
- Sourcing practices
- Mixed — credits primary outlets on some videos, but amplifies misleading charts and 'just asking questions' election-fraud framing without correction
- Content type
- Partisan news aggregation + viral crime/accident video + election-denial commentary
Account checked November 12, 2026, 14:58 UTC
The media
Image✓ What is genuine
The graphic is a genuine hand-made data chart with a real, accurately drawn Michigan county map. The problem is the framing and the missing context, not the image's authenticity.
The tells
- ●●● Strong signal The map shows a correctly shaped Michigan with the Upper and Lower Peninsulas and plausible county boundaries.our visual review
- ●●● Strong signal Labels, numerals and legend are legible and consistent; no garbled text or impossible geography typical of generated images.our visual review
- ●●○ Supporting signal The graphic is watermarked to the posting account, consistent with a hand-built chart rather than a photograph.our visual review
- ●●○ Supporting signal Figures like 107.9% are internally consistent with how the chart's own labels are constructed.our visual review
Synthetic-media detector
Detector not consultedThe media is incidental to the claim; the detector was not needed.
How we checked the media
- Visual review of the graphic: layout, typography, county map geography and internal consistency of the figures.
- Compared the graphic's numbers against official and news reporting on Michigan registration totals and Census estimates.
- Checked whether the claims depend on the image being genuine — they do not, since the figures can be checked against state and Census data.
Sources
8 sources reviewed- 1Michigan gubernatorial primary revives old misinformation about voter rolls ↗
AFP Fact Check · factcheck.afp.comPrimary / fact-checkerIFCN + EFCSN; wire-backedEvidence
Establishes that the misleading element is the use of total rather than active registrations, and that law requires retaining inactive records.
- 2Social media posts mislead about Michigan's voter rolls and election fraud ↗
PolitiFact · politifact.comPrimary / fact-checkerIFCN signatory (Poynter)Evidence
Provides the State Department's figures of about 8.4 million total registrations and 7.2 million active voters.
- 3No, Michigan does not have more active voters than people eligible to vote ↗
Votebeat · votebeat.orgUntiereduntiered — treated as signal only, never decisiveEvidence
Quotes the federal judge finding no ineligible person appearing as an active voter, and confirms active rolls are below the eligible population.
- 4No, Michigan does not have more voters than residents eligible to vote ↗
States Newsroom / Votebeat · newsfromthestates.comUntiereduntiered — treated as signal only, never decisiveEvidence
Explains the claim rests on a misunderstanding of what the voter file contains relative to Census data.
- 5An independent watchdog scoured Michigan's voter roll for noncitizens. Here's what they found. ↗
Votebeat · votebeat.orgUntiereduntiered — treated as signal only, never decisiveEvidence
Reports the auditor general's finding that 99.99 percent of 8.3 million records had complete and valid data.
- 6Michigan elections FAQ: More registered voters than eligible voters? ↗
Bridge Michigan · bridgemi.comUntiereduntiered — treated as signal only, never decisiveEvidence
Gives the 8.3 million registration figure against a 7.9 million voting-age estimate and notes the excess includes expiring registrations.
- 7Fact Check: There Were NO 353 Counties In 29 States With Voter Registrations Exceeding 100% of Eligible Voters ↗
Lead Stories · leadstories.comPrimary / fact-checkerIFCN; strong on viral/AI mediaContext
Documents an earlier, related viral comparison of registrations to survey-based population estimates and why it misled.
- 82025 Voter Registration Totals ↗
Michigan Department of State · michigan.govPrimary / fact-checkerprimary/official source (by domain)Context
Confirms that official county and statewide registered voter counts exist as a primary source.
Further reading
- 1AFP Fact Check AFP's 2026 check on the revived claim explains the inactive-registration rule directly.
- 2PolitiFact PolitiFact gives the State Department's total and active voter figures side by side.
- 3Votebeat Votebeat reports the federal judge's finding, the strongest single piece of evidence against the fraud inference.
- 5Votebeat The auditor general review's data-accuracy findings show what the voter file actually looks like.
- 6Bridge Michigan Bridge Michigan explains the Census comparison and why the totals differ.
The full story
Michigan's voter file really does hold more registrations than the state has citizens of voting age. Bridge Michigan reported state data of about 8.3 million registered voters against a Census estimate of 7.9 million voting-age citizens. PolitiFact put the total near 8.4 million with about 7.2 million active voters. So a figure in the 105 to 110 percent range is not invented.
The explanation is administrative, not sinister. Under the National Voter Registration Act and Michigan law, election officials cannot simply delete a registration the moment someone stops voting. Records stay on the file as inactive until the voter has sat out two federal election cycles, and only then can they be cancelled. During that window they still count in the total while not counting as active. The state auditor general's 2026 review found 99.99 percent of the 8.3 million records had complete and valid data, and nearly one million registrations had been cancelled since 2022.
The denominator carries its own uncertainty. The citizen voting-age figure is a Census estimate built from surveys, not a headcount of registered people, and it moves from year to year.
That is why this comparison keeps returning. A real, checkable number — the kind a reader can look up — gets wrapped in a heading that asserts a conclusion the number cannot support. The post's own final line, that active rolls are at 95.9 percent, is the fact that undoes the alarm above it.
Kernel of truth
Michigan's total voter-file registrations genuinely exceed its estimated citizen voting-age population, largely because of inactive records the state is legally required to retain.
Timeline
September 2023
Lead Stories fact-checks a related viral claim that 353 counties across 29 states had registrations above 100 percent of eligible voters, finding the comparison of all registrations to survey-based estimates misleading. 7Lead Stories
October 2024
A federal judge dismisses the RNC's suit over Michigan's voter rolls, noting plaintiffs identified no ineligible person appearing as an active voter. 3Votebeat
October 2024
PolitiFact and Votebeat publish fact checks explaining that Michigan's total includes inactive registrations and that active voters do not exceed the eligible population. 2PolitiFact
November 2025
The data snapshot date printed on the graphic: county-level registration ratios compared with Census adult citizen estimates.
August 2026
AFP Fact Check rates a revived version of the claim misleading, noting election law requires retention of inactive registrations. 1AFP Fact Check
September 2026
A nonpartisan Michigan auditor general review finds 99.99 percent of the 8.3 million records have complete and valid data. 5Votebeat
November 9, 2026
The @_Patriot1776Q_ account posts the graphic on X, with a Chinese-language repost following on Toutiao two days later.
How it was framed
Every ingredient is real — genuine registration totals, a genuine legal category of inactive records, a genuine county map — but they are assembled to frame a routine administrative feature as an election problem. The post also recycles a November 2025 snapshot in a November 2026 post, giving old data the appearance of current urgency.
- Ongoing-threat framing. The post opens with a siren emoji and the all-caps heading "ELECTION ISSUES", presenting a static data snapshot as an active problem.
- Missing context. The caption lists county overages without mentioning that the totals include inactive registrations the state cannot yet cancel.
- “Visual proof”. A detailed county map with percentages and precise overage figures is presented as self-evident proof.
- Selective evidence. The qualifying line "Active rolls are at 95.9 percent" appears at the end, after the alarm has been set, and is not reconciled with the 107.9 percent headline.
- Unsourced statistic. No source or method is given for the county-level ratios, including Wayne County's 111.7 percent and its 151,636 overage.
Posted on X by the account @_Patriot1776Q_ on 9 November 2026. The graphic carries a November 2025 data date. The same text appeared in a Chinese-language repost on Toutiao on 11 November 2026.
Bias
Leans election-fraud alarmism / pro-voter-ID, right-leaning. The graphic is built to read as a scandal: a red-alert 'ELECTION ISSUES' banner over a map colored to show almost every county 'over 100%', with no explanation that the excess consists of inactive records state law requires to be retained. The single line about inactive registrations and 95.9% active rolls is buried at the very end of the caption, while the alarming county percentages dominate. The account is a conservative election-integrity amplifier; the framing pushes the narrative that Michigan's rolls are illegitimate, a claim courts and fact-checkers have rejected.
Bias describes how the post frames its message — the slant of the language, selection and emphasis — and is judged separately from whether the claim is true. A true claim can still be framed with a strong slant.
How we checked
1 min 6 s- 1
Searched for existing fact checks and reporting on Michigan voter registration totals compared with Census population figures.
- 2
Compared the graphic's statewide and county figures against official and news reporting, including the Michigan Department of State's published county totals.
- 3
Reviewed the graphic visually for signs of fabrication or manipulation.
- 4
Read the federal court finding and the 2026 auditor general review as reported by fact-checkers and Votebeat.
- 5
Ran searches to see whether the exact county-level percentages appeared in any official or news publication.
✓ Claim checked✓ Media checked✓ Sources checked
Why 75% confidence
HighWe are highly confident in the overall MISLEADING verdict because a court, a state audit and three independent newsrooms converge on the same explanation, and the post's own caption concedes the key point. Individual county figures sit at low confidence because no official publication carries them, which is also why the specific county claim is marked unverifiable rather than true or false.
Limits. We did not open or download the underlying voter file or the Census tables, so we could not recompute any ratio ourselves. The exact county-level figures could not be traced to a published source, and we could not identify who compiled them.
What we don’t know
- Who produced the county-by-county analysis behind the graphic, and what Census table or year it used.
- Whether the inactive count of 921,708 corresponds to an exact dated state publication.
- Why a November 2025 snapshot was posted in November 2026, and whether the account was aware of the earlier fact checks.
Spot it yourself
Find the overstatementLooks suspicious, isn’t proof
- An anonymous, partisan-sounding account name and a siren emoji. Tone tells you to slow down, not that the numbers are wrong.
- The all-caps "ELECTION ISSUES" heading. Alarm is a style choice, not evidence.
- Precise-looking figures like 151,636 and 921,708. Precision can be real or invented; it proves nothing by itself.
- A slick county map graphic. Production quality is not a credibility signal in either direction.
The actual evidence
- The post's own final line: active rolls at 95.9 percent, which contradicts the alarm in its headline.
- The federal court ruling that plaintiffs could not name a single ineligible person appearing as an active voter.
- The National Voter Registration Act's retention rule, which explains why inactive records inflate the total.
- The auditor general's finding that 99.99 percent of 8.3 million records had complete, valid data.
- The county-level figures could not be matched to any official or news publication.
- 1
Separate total registrations from active registrations
Ask what the number counts. A registration list includes people who have not voted recently but cannot legally be removed yet. Active voter counts are the meaningful comparison to population.
- 2
Check the denominator
"Census adult citizens" is a survey-based estimate, not a headcount. If a chart doesn't name the exact table or year, the percentage is only approximate.
- 3
Ask who would be reporting this if true
If a state's rolls were genuinely compromised, the secretary of state, courts and local election officials would be the story. A claim that appears only in one account's graphic and its reposts has no such trail.
- 4
Find the source of the county numbers
Look for a link, method or dataset behind figures like 111.7 percent. If there is none, treat the numbers as unverified even if they sound plausible.
- 5
Read the whole caption
Here the correction is in the last line. Posts that lead with alarm often bury the qualifier at the end.
Takeaway
A real number can be paired with a false conclusion. Before accepting the framing, check what the number counts, what the comparison actually measures, and whether the post's own details contradict its headline.
Questions people ask
Does Michigan really have more registered voters than eligible citizens?+
Its total voter file does hold more registrations than the estimated citizen voting-age population — roughly 8.3 to 8.4 million against about 7.9 million. But that total includes hundreds of thousands of inactive records the state is legally required to keep for at least two federal election cycles. Active registrations are below the eligible population.
What is an inactive voter registration?+
A record kept on the voter file for someone who has not voted recently or has not responded to a confirmation notice. Federal and state law bar officials from cancelling it until the person has missed two federal election cycles. Inactive records still count in the total but are not counted as active voters.
Did a court rule on this claim about Michigan's rolls?+
Yes. In October 2024 a federal judge dismissed the RNC's suit over Michigan's voter rolls, noting that the plaintiffs did not identify a single voter in any county who was ineligible to be registered but nonetheless appeared as an active voter.
Why do these voter-roll claims keep coming back?+
The underlying number is real and easy to look up, which makes the claim feel verified. The missing piece — that the total includes inactive records the law requires the state to retain — is legal and administrative, so it does not travel as fast as the chart. AFP rated a revived version misleading in 2026.
How accurate is the state's voter file?+
A nonpartisan Michigan auditor general review in 2026 found 99.99 percent of the 8.3 million records had complete and valid data, and that nearly one million registrations had been cancelled since 2022. That does not prove no errors exist, but it undercuts the idea of a systematically broken list.
Go deeper
- Qualified Voter File (QVF)
- Michigan's official statewide database of registered voters, which includes both active and inactive records.
- Inactive registration
- A voter record kept on file but not counted as active because the voter has not recently voted or responded to confirmation, and which cannot legally be cancelled until set conditions are met.
- National Voter Registration Act
- A 1993 federal law that sets rules for maintaining voter rolls, including how long inactive registrations must be kept before removal.
- Citizen voting-age population
- A Census estimate of adult citizens, built from survey data rather than a direct count of people, and therefore carrying a margin of error.
- Misleading content
- Real information used in a way that frames an issue or person falsely, as distinct from content that is entirely made up.
People also search for
For educators+
- The post's own last line says active rolls are at 95.9 percent. How does that change the meaning of the 107.9 percent headline above it?
- If a number is real but the conclusion drawn from it is not, how should a reader describe the problem — as lying, as misreading, or something else?
- What would you want to see published alongside this chart for it to be an honest presentation of the data?
About this check
- Platform
- X
- Posted by
- @_patriot1776q_
- Posted
- November 10, 2026
- Age when checked
- 1–2 days old when checked
- Where it spread
- United States
- Audience
- US audience
- Language
- EN
- Status
- ● Post is live
- Verified
- November 12, 2026, 14:59 UTC
- Published
- November 12, 2026, 14:59 UTC
Reach. 7.5K likes, 621 replies (X syndication, 2026-11-12); part of a multi-state series (CO, AK, MI...) fact-checked by Lead Stories 11-12 Nov
This verdict was generated with AI from the sources shown. AI can make mistakes — check the sources before relying on it.
Check anything yourself, in seconds.
Share any social post or video to What the Fact and get the verdict, the confidence, and the receipts.