Did a jamming map show GPS interference along NATO's entire eastern flank?
Is GPS jamming attributed to Russia affecting virtually the entire eastern flank of NATO, as a viral jamming map suggests?
Can't verify
The map is real and accurately described, but it cannot show who caused the jamming.
The map is the genuine ItaMilRadar interference graphic for 3 November 2026, built on AirNav Radar aircraft data, and its caption accurately describes it. Multiple defence outlets independently reported the same near-continuous band of strong GPS jamming along NATO's eastern border. The map shows where navigation failed — not who jammed it, which remains unconfirmed.
 Genuine
Claims
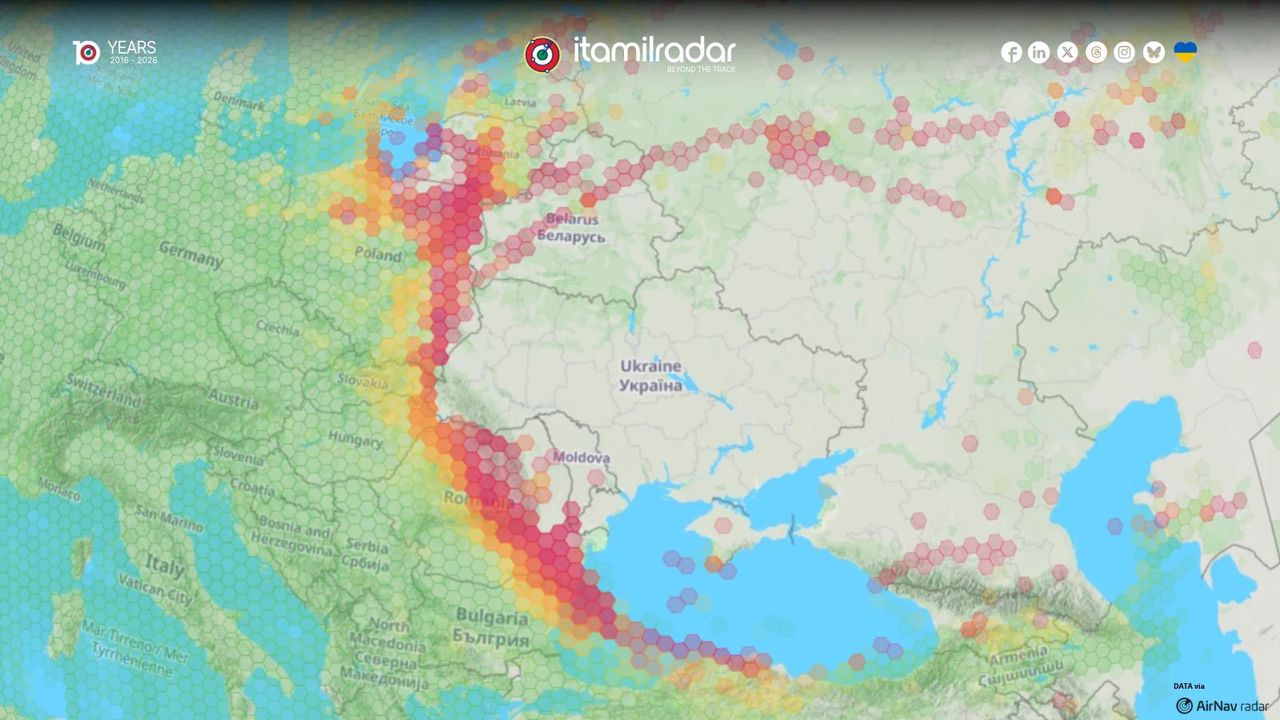
✓ 2 trueThe jamming map for 3 November 2026 shows strong, geographically concentrated satellite-navigation interference along virtually the entire eastern border of NATO.126
The graphic in the post is the one ItaMilRadar published with this wording on 4 November 2026, and defence outlets in several countries described the same map within the following day. Defence Blog describes interference hitting almost the entire length of NATO's eastern border on 3 November; Militarnyi gives the same date and says the map was built on AirNav Radar data. That matters because the outlet accounts and the map are not wholly independent: several trace back to the single AirNav Radar dataset. But the map itself is published in the post, so the claim can be tested against the picture rather than only against repeated text. The shaded hexagons form an almost unbroken band along the eastern border, matching the descriptions. A separate counter, GPSInterference.com, tallied 1,035 high-interference cells that day, consistent with the scale shown. Together this is enough to say the description is accurate.
Still open: Could the same map have been reposted with altered shading somewhere else? Our sources describe the original, not any copies.
The densest interference sits near Kaliningrad, along Poland's borders with Belarus and Ukraine, over Romania and Moldova, and along Bulgaria's Black Sea coast, with lighter effects over Belarus, western Russia, Crimea and the Caucasus.145
This is a description of the picture, and it holds up against both the picture and the reporting. Adevarul describes an almost continuous jamming zone crossing Lithuania, eastern Poland, Romania and Bulgaria to the western Black Sea. Militarnyi says the heaviest concentration was along NATO borders with Russia, Belarus and Ukraine. Novosti and Defence Blog describe the same broad band. The image in the post matches: dense red cells around Kaliningrad, a chain through Lithuania and eastern Poland, clusters over Romania and Moldova, and shading along the Bulgarian coast, with scattered lighter cells over Belarus, western Russia, Crimea and the Caucasus. That is what aircraft-derived interference maps look like — the coloured cells follow flight corridors, so the pattern traces where aircraft flew and lost navigation accuracy, not a tidy geographic zone. The description is a fair reading of the graphic rather than an overstatement.
The interference can be attributed to a single actor, Russia.13
This reading is not in the caption — the post names no culprit — but it is how many readers take a map of this kind, so we checked what the evidence could support. It does not confirm anyone. Aircraft-derived maps show where navigation accuracy was lost, not what caused the loss or who operated it. Defence Blog states this plainly, and Defence24 notes there is no unambiguous evidence that Russia alone is responsible. Part of the band may come from counter-drone jamming by NATO states themselves, which would produce interference on the same map. No government has confirmed responsibility for the interference on 3 November. We treat this as unverifiable rather than false: it might turn out to be right, but nothing in our evidence establishes it, and the caution limits how the map should be interpreted rather than undermining the caption.
Still open: Attribution would need government confirmation, seizure of jamming equipment, or signal-direction data that the public does not have.
What was posted
XA post on X by the Italian OSINT flight-tracking project ItaMilRadar sharing its own interference map for the previous day. The attached graphic is a hexagon-grid chart of Central and Eastern Europe with a band of red and yellow cells running from the southern Baltic to the Black Sea. The caption asks readers to read the shading as strong, geographically concentrated jamming along NATO's eastern border. The post names no culprit.
“Yesterday’s jamming map is particularly interesting. Virtually the entire eastern flank of NATO is affected by strong, geographically concentrated jamming along the eastern border.”
Posted by ItaMilRadar itself, not shared second-hand; the claim and the graphic originate from the same account.
Who posted it
XAccount check
Estimates from public signals — account age, posting pattern, audience — not a judgement of the person behind the account, and separate from whether this post is true.
What stood out
- ItaMilRadar is an established Italian OSINT project launched as a Twitter account in 2016 and expanded to a website in 2019.
- It publishes transparent methodology: aircraft and ship movements derived from public ADS-B/flight-tracking platforms such as Flightradar24, AirNav Radar and ADS-B Exchange.
- Frequently cited by Italian and international media, including Il Giornale, Corriere della Sera, La Repubblica, The Guardian, Defence Blog, BGNES, bTV and Defence24.
- Recent November 2026 coverage of GPS jamming and NATO surveillance flights was widely picked up by mainstream and defence outlets, consistent with its track record.
- Recognised by other Italian OSINT practitioners as a serious and professional source; no significant fact-check or correction history found.
- Caveat: its output is data interpretation, not official confirmation, and media sometimes overstate its flight-tracking maps as definitive evidence of intent or origin.
- Account is not platform-verified and profile metadata is sparse, but this is typical of an independent project rather than evidence of inauthenticity.
- No indication of automated bot behaviour; posting reflects manual monitoring and analysis, though it relies on automated flight-data feeds.
- A Telegram channel using the same name has been flagged by Telegram as fake/scam, but this appears to be an impersonation separate from the X account.
Signals (11)+
- Project launched
- 2016
- Website launched
- 2019
- Follower count approx
- 45000
- Platform verification status
- No
- Transparent methodology
- Yes
- Media citation frequency
- High
- Notable news coverage
- Il Giornale; Corriere della Sera; La Repubblica; The Guardian; Defence Blog; Defence24; BGNES; bTV
- Fact check history
- No adverse findings located
- Posting cadence
- Frequent, event-driven OSINT reporting
- Automation level
- Uses automated flight-tracking data but analysis appears human-curated
- Impersonation risk
- Telegram channel with same name flagged as fake
Account checked November 6, 2026, 14:52 UTC
The media
Image✓ What is genuine
The whole graphic: the hexagon map, its shading pattern, the branding and the AirNav Radar credit. The data behind it is real aircraft tracking, and the map matches how multiple outlets describe the same published image.
The tells
- ●●● Strong signal Our detector scored the image as almost certainly not AI-generated (99.99% confidence in the 'not AI generated' class).our detector
- ●●○ Supporting signal The map carries ItaMilRadar's own logo, a 2016–2026 anniversary mark and an explicit 'DATA via AirNav radar' credit — a data product with a named pipeline, not a decorative picture.our visual review
- ●●○ Supporting signal The interference cells follow real aircraft corridors, which is exactly how a flight-data-derived map looks; invented charts tend to produce abstract blobs.our visual review
Synthetic-media detector
Detector ranThe claim stands or falls on whether the media is real, so the detector ran.
Scores are the detector’s estimate for the file as uploaded. A low score does not rule out editing, a spliced caption, or footage shown out of context — those are judged above. Model v3.
How we checked the media
- Visual review of the graphic: hexagon-grid interference map over a Central and Eastern Europe basemap, carrying ItaMilRadar branding, a '10 YEARS 2016-2026' logo and a 'DATA via AirNav radar' credit.
- Checked internal consistency: coloured cells trace aircraft flight corridors, country labels are correctly spelled, no garbled text or impossible geometry.
- Ran our AI-image detector (Hive v3) on the attached image.
- Compared the shading with how Defence Blog, Militarnyi, Adevarul and Novosti describe the same published map.
Sources
6 sources reviewed- 1GPS jamming hits almost all of NATO's eastern flank in one day ↗
Defence Blog · defence-blog.comUntiereduntiered — treated as signal only, never decisiveEvidence
Reports the eastern-flank interference on 3 November and stresses that such maps do not identify the source.
- 2From the Baltic to the Black Sea: Large-Scale GPS Jamming Detected Along NATO Borders ↗
Militarnyi · militarnyi.comUntiereduntiered — treated as signal only, never decisiveEvidence
Dates the map to 3 November 2026 and identifies AirNav Radar as its data source.
- 3Ruchy Rosji przy polskiej granicy? Ogromne zakłócenia na wschodniej flance NATO ↗
Defence24 · defence24.plUntiereduntiered — treated as signal only, never decisiveEvidence
Notes there is no unambiguous evidence Russia alone is responsible and raises possible NATO counter-drone jamming.
- 4Harta care provoacă îngrijorare în NATO: bruiaj GPS pe aproape întreg flancul estic, inclusiv în România ↗
Adevarul · adevarul.roUntiereduntiered — treated as signal only, never decisiveEvidence
Describes the band crossing Lithuania, eastern Poland, Romania and Bulgaria to the western Black Sea.
- 5Ometanje GPS signala zahvatilo gotovo ceo istočni bok NATO-a u jednom danu ↗
Novosti · novosti.rsUntiereduntiered — treated as signal only, never decisiveEvidence
Confirms the 3 November date and that no government named a culprit.
- 6Rusko zaslepilo GPS od Baltu po Černé moře ↗
Armádní zpravodaj · armadnizpravodaj.czUntiereduntiered — treated as signal only, never decisiveEvidence
Cites an independent counter of 1,035 high-interference hexagon cells that day.
Further reading
- 1Defence Blog Defence Blog's account clearly explains what such maps show and what they cannot show about the source.
- 3Defence24 Defence24 adds the caution that part of the band may come from NATO counter-drone jamming.
- 6Armádní zpravodaj Provides the independent interference tally of 1,035 cells on the day.
The full story
The kernel of truth here is large. On 3 November 2026, aircraft tracking data compiled by ItaMilRadar from AirNav Radar recorded degraded GPS and other satellite-navigation signals in a band running from the southern Baltic through Lithuania, eastern Poland, Romania and Bulgaria to the western Black Sea. Defence and mainstream outlets in at least six countries reported the same map within days. An independent interference counter, GPSInterference.com, recorded 1,035 high-interference hexagon cells on the day, which fits the scale of what the graphic shows.
That pattern is genuinely striking, and the map is drawn in the way interference data naturally looks: the coloured cells follow flight paths, so a dense chain of red hexagons tracks where aircraft were flying when their navigation degraded. It is a record of lost accuracy, not a picture of a weapon or an operator.
That is the limit readers should hold on to. Nothing in aircraft data says who caused the interference. No government has confirmed responsibility for the 3 November band. Defence24 noted that part of it could come from counter-drone jamming by NATO states themselves — equipment that would light up the same map. So the map supports the caption and not much beyond it: the eastern flank did experience strong, concentrated interference, and the source of it is still unresolved.
Kernel of truth
Aircraft tracking data genuinely recorded a near-continuous band of severe GPS interference along NATO's eastern border on 3 November 2026, and the map is a faithful rendering of it.
Timeline
November 3, 2026
Aircraft data records a near-continuous band of strong satellite-navigation interference along NATO's eastern border, heaviest near Kaliningrad, eastern Poland, Lithuania, Romania, Moldova and Bulgaria's Black Sea coast. 1Defence Blog
November 4, 2026
ItaMilRadar publishes the interference map on X with the caption in this post. 1Defence Blog
November 4, 2026
Defence and mainstream outlets, including Militarnyi, Defence Blog, Defence24, Adevarul, Novosti and GPSInterference.com, report the same map and note the source of the jamming is unidentified. 2Militarnyi
How it was framed
The post is a genuine data map from the source it credits, and its caption describes what the map shows without adding an attribution. The accurate label applies to the claim as posted; the question of who caused the interference is a separate, unverifiable one that the caption does not raise.
- “Visual proof”. The post leads with a dense band of red hexagons along the border, which reads as dramatic evidence even though the graphic records lost navigation accuracy, not an attacker.
- Ongoing-threat framing. 'Virtually the entire eastern flank of NATO is affected' frames the interference as an alliance-wide event rather than a set of scattered disruptions.
- Missing context. The caption does not say what the map can and cannot show — that it records where aircraft lost navigation accuracy and cannot identify a source.
Posted by the Italian OSINT flight-tracking account ItaMilRadar, which credits the underlying data to AirNav Radar and publishes daily interference maps. The post is the original source of the map, not a repost.
Bias
Leans NATO security-threat framing. The caption is a factual read of a data map and names no culprit, but highlighting that 'virtually the entire eastern flank of NATO' is affected frames the interference as an alliance-wide security threat. Specialised outlets that relayed the map added the balancing caveat that the source of the jamming is unconfirmed.
Bias describes how the post frames its message — the slant of the language, selection and emphasis — and is judged separately from whether the claim is true. A true claim can still be framed with a strong slant.
How we checked
59 s- 1
Searched for coverage of the claimed event: 'GPS jamming eastern flank NATO map November 2026'.
- 2
Searched for the map's origin: 'itamilradar jamming map GPS interference Poland Baltic'.
- 3
Searched specifically for prior fact checks: 'GPS jamming NATO eastern flank map fact check ItaMilRadar November 3 2026'.
- 4
Ran our AI-image detector (Hive v3) on the attached graphic.
- 5
Reviewed the image visually and compared its shading with the descriptions in the resulting coverage.
✓ Claim checked✓ Media checked✓ Sources checked
Why 40% confidence
LowThe headline is CANT VERIFY at LOW confidence for the wider claim, because the post's caption describes the map correctly while the question of who caused the jamming remains unresolved. The individual claims split: the central claim about the map and the secondary claim about the geography are TRUE at HIGH confidence, since the picture and multiple independent descriptions agree; the attribution reading is UNVERIFIABLE at MODERATE confidence, since the post never makes it and no source confirms it. The LOW headline confidence reflects that the checked claim as read by many is about responsibility, not the map.
Limits. We did not open the original pages behind our search results — our findings rest on the search snippets and the source records. We did not separately review the AirNav Radar dataset, and we had no government statement to consult on attribution.
What we don’t know
- Who actually caused the 3 November interference. No government has confirmed responsibility, and part of the band may reflect NATO counter-drone jamming.
- How much of the band came from each type of source, since aircraft data cannot separate hostile jamming from friendly countermeasures.
- Whether the same pattern persisted on days before or after 3 November — we checked only the dated coverage of this map.
Spot it yourself
Why it looked fakeLooks suspicious, isn’t proof
- A social-media account publishing its own map, with no news outlet behind it. OSINT projects are legitimate sources, but being independent is a reason to verify, not to dismiss.
- Dramatic red shading across half a continent, which looks alarmist. Colour choices in data visualisations are a design decision, not evidence either way.
- A caption that leaves out the source of the jamming. Missing context is common and worth flagging, but it does not make the map itself wrong.
The actual evidence
- The graphic is the same one outlets in at least six countries described, with matching geography and date.
- Our AI-image detector scored it as 99.99% not AI-generated, consistent with a genuine screenshot of a data product.
- The map carries ItaMilRadar's own branding and an explicit AirNav Radar data credit.
- The cells follow aircraft corridors, which is how flight-data interference maps are drawn.
- An independent counter recorded 1,035 high-interference cells on the day, fitting the scale shown.
- 1
Find the original source of the map
Search the credit line on the graphic — here 'AirNav radar' and the account name — and check whether the account published it on the date claimed.
- 2
Ask who else reported the same picture
Search the date and place (for example 'GPS jamming eastern flank 3 November 2026') and see whether outlets in more than one country describe the same map.
- 3
Check whether the graphic is AI-generated
Run it through a detector, but remember a 'not AI' result only shows the image is real — not that its caption is complete.
- 4
Separate what the data shows from what it implies
For any map of interference, ask: does this record an effect, like lost signal, or an actor? If it is an effect, look for the word 'source unknown'.
- 5
Look for officially confirmed attribution
Track down whether a government or alliance has named a culprit. If nobody has, do not treat the map as proof of one.
Takeaway
A real map can carry a real event and still not tell you who did it. Check what the data measures before you accept what the caption implies.
Questions people ask
Is the ItaMilRadar jamming map fake?+
No. The graphic is the genuine map ItaMilRadar published on 4 November 2026, built on AirNav Radar aircraft data. Outlets in at least six countries described the same map, and our AI-image detector found no sign it was generated. The map is real; the open question is what caused the interference.
What did the jamming map for 3 November 2026 actually show?+
A near-continuous band of degraded GPS and satellite-navigation signals from the southern Baltic through Lithuania, eastern Poland, Romania and Bulgaria to the western Black Sea. Interference was densest around Kaliningrad, along Poland's borders with Belarus and Ukraine, over Romania and Moldova, and off Bulgaria's Black Sea coast.
Can a jamming map tell you who is doing the jamming?+
No. Aircraft-derived maps like this record where navigation accuracy was lost, not what caused it. Defence Blog and Defence24 both stress that the source is unidentified, and part of the band could come from NATO counter-drone jamming rather than a hostile actor.
Why is the overall verdict 'can't verify' if the map is genuine?+
Because the claim as readers often understand it is about responsibility — that NATO's flank is being jammed by an adversary — and no evidence confirms that. The caption itself is accurate; the broader reading of it is what cannot be verified.
How common is this kind of GPS interference in the region?+
Our sources cover this single day and describe the band as unusually broad. They do not give a longer trend, so we cannot say from this check whether it is typical or an escalation.
Go deeper
- GPS jamming
- Deliberately transmitting interference that drowns out satellite-navigation signals so devices cannot work out their position.
- OSINT
- Open-source intelligence: information gathered from publicly available material such as flight-tracking data rather than secret sources.
- Attribution
- Establishing who was responsible for an action, such as identifying which actor caused interference.
- Hexagon cell
- A single hexagon tile in a gridded map, used to count and shade areas where interference was detected.
- AI-image detector
- A model that estimates whether a picture was generated by artificial intelligence rather than captured or rendered from real data.
People also search for
For educators+
- Several news outlets cited the same map. Does that count as several independent sources? Why or why not?
- The post never names a culprit, but many readers will assume one. Should the poster have said more — and does that change whether the post is true?
- If you were shown this map with no caption, what would you be able to conclude, and what would you need before judging who is responsible?
About this check
- Platform
- X
- Posted by
- @itamilradar
- Posted
- November 4, 2026
- Age when checked
- Older post, still live
- Where it spread
- PL, FI, EE, LV, LT, Russia
- Audience
- International audience
- Language
- EN
- Status
- ● Post is live
- Verified
- November 6, 2026, 14:54 UTC
- Published
- November 6, 2026, 14:54 UTC
Reach. 3,455 likes, 55 replies (X syndication); Mimikama fact check 5 Nov, still circulating in German-language posts
This verdict was generated with AI from the sources shown. AI can make mistakes — check the sources before relying on it.
Check anything yourself, in seconds.
Share any social post or video to What the Fact and get the verdict, the confidence, and the receipts.